

What is a Good ROAS?
A good ROAS (Return On Ad Spend) is commonly cited as 4:1 — £4 in revenue for every £1 spent (400%) — as a general baseline for profitable advertising. But that number is only a starting point. The ROAS you actually need depends entirely on your profit margin.
A business with 70% margins can thrive on a 2:1 ROAS. A business with 20% margins can lose money at 4:1. So the real definition of a "good" ROAS is: comfortably above your break-even ROAS, with enough headroom to cover overheads and profit.
As rough guidance for 2026: below 2:1 is usually unprofitable for most businesses, 3:1–4:1 is solid, 5:1+ is strong, and lead-generation or high-margin businesses often target 6:1–10:1 on tracked revenue. The rest of this guide gives you the benchmarks and the formula to find your own target.
How Do You Calculate ROAS?
ROAS is simple: revenue generated from ads ÷ amount spent on ads.
- Spend £2,000 on Google Ads, generate £8,000 in tracked revenue → ROAS = 4:1 (400%).
- Spend £2,000, generate £5,000 → ROAS = 2.5:1 (250%).
It can be written as a ratio (4:1), a multiple (4x) or a percentage (400%) — all mean the same thing.
The catch is accurate revenue tracking. For e-commerce, that means correctly configured conversion tracking with real order values. For lead generation, you need to connect ad platforms to your CRM so "revenue" reflects closed deals, not form fills. Garbage tracking produces garbage ROAS — which is why measurement setup is the first thing our PPC management team fixes on any account.
What is the Difference Between ROAS and ROI?
They sound similar but answer different questions.
ROAS measures revenue against ad spend only. It ignores your product costs, agency fees, and overheads. ROAS = revenue ÷ ad spend.
ROI measures profit against your total investment. It accounts for cost of goods, fees and margins. ROI = (profit − total cost) ÷ total cost.
Why it matters: a campaign can show a healthy 4:1 ROAS and still lose money if margins are thin once you have factored in product cost, fulfilment and management fees. ROAS is the fast, day-to-day optimisation metric; ROI (or profit on ad spend, POAS) is the truth about whether the campaign builds your business. Track ROAS daily, but judge success on profit.
What is a Good ROAS by Industry? (UK 2026 Benchmarks)
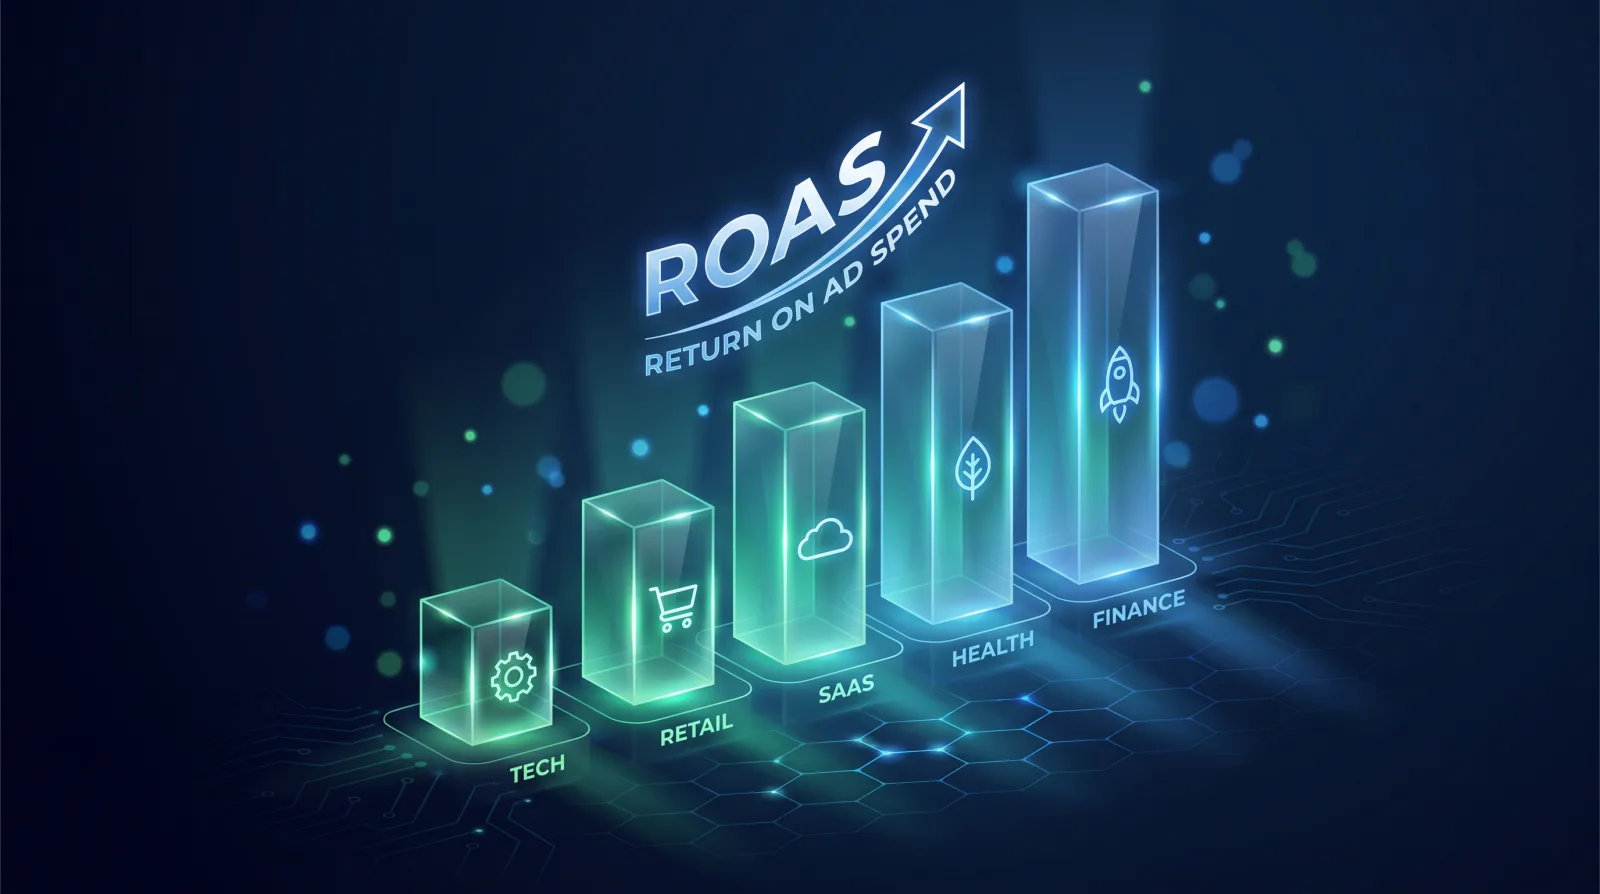
ROAS expectations vary widely by sector, mostly driven by margin and average order value. Typical UK ranges we see across managed accounts and industry data in 2026:
- Fashion & apparel: 3:1–4:1 (competitive, promotion-driven, returns eat margin)
- Health, beauty & cosmetics: 4:1–6:1 (strong margins, high repeat purchase)
- Home, garden & furniture: 3:1–5:1 (high AOV offsets longer consideration)
- Electronics & tech: 2:1–3:1 (thin margins demand efficient spend)
- Food, drink & FMCG: 3:1–4:1 (low AOV, wins on repeat and subscription)
- Local services & trades: 5:1–10:1+ on tracked revenue (high job value, high intent)
- Professional & legal services: 5:1–10:1+ (very high client value; measured on closed revenue)
- SaaS & subscription: 2:1–4:1 on first purchase, far higher on lifetime value
- Luxury & high-AOV: 2:1–3:1 can still be highly profitable due to margin
Use these as a reality check, not a target. Your break-even ROAS (next section) is what actually sets the bar.
What is Break-Even ROAS and Why Does It Matter Most?
Break-even ROAS is the point where ad-driven revenue exactly covers your costs — spend any less efficiently and you lose money. It is the single most useful number in paid media, and most businesses never calculate it.
The formula: Break-even ROAS = 1 ÷ profit margin.
- 50% margin → break-even ROAS = 2:1
- 33% margin → break-even ROAS = 3:1
- 25% margin → break-even ROAS = 4:1
- 20% margin → break-even ROAS = 5:1
So a "good" 4:1 ROAS is barely break-even for a 25%-margin retailer, but hugely profitable for a 70%-margin service business. Calculate your break-even first, then set your target ROAS above it with enough margin for overheads and profit. This is why a headline "good ROAS" number is meaningless without your margins.
What Factors Affect Your ROAS?
If your ROAS is below target, the cause is almost always one of these:
- Profit margin and AOV — higher margins and bigger baskets make strong ROAS far easier to hit.
- Targeting precision — wasted impressions on the wrong audience or broad-match keywords without negatives drain spend.
- Landing page conversion rate — the single biggest lever. Doubling conversion rate roughly doubles ROAS for the same spend, which is why CRO compounds paid results.
- Creative and ad relevance — higher relevance means cheaper clicks and better Quality Score.
- Funnel stage — cold prospecting always shows lower ROAS than retargeting; blend them and judge blended ROAS.
- Attribution window and tracking — under-tracking (especially phone calls) makes a good campaign look bad.

How Does ROAS Differ by Ad Platform?
Different platforms produce different ROAS profiles, so compare like with like:
- Google Search Ads: often the highest ROAS because you capture existing intent — but limited by search volume.
- Meta Ads: lower ROAS on cold prospecting, strong ROAS on retargeting; excels at demand generation rather than pure efficiency.
- Amazon Ads: high-intent marketplace traffic, competitive ROAS for product sellers, though fees compress true profit.
- Google Shopping and Performance Max: strong for e-commerce with clean product feeds.
One platform's 3:1 can be more valuable than another's 6:1 once you account for volume and funnel role. For lead-gen specifically, see our comparison of Google Ads vs Meta Ads for lead generation.
How Do You Improve a Low ROAS?
Improving ROAS is rarely about "bidding better" — it is about fixing the leaks. In priority order:
- Fix tracking first — you cannot improve what you measure wrong. Confirm conversion values and call tracking are accurate.
- Improve the landing page — a CRO programme that lifts conversion rate from 2% to 4% doubles ROAS with zero extra ad spend.
- Cut waste — add negative keywords, exclude poor placements and audiences, pause losing products and ads.
- Tighten targeting — concentrate budget on your best-converting segments, locations and times.
- Refresh creative — new angles lift click-through and relevance, lowering cost per click.
- Increase AOV — bundles, upsells and higher-value offers raise revenue per conversion.
Most "ROAS problems" are actually conversion or tracking problems — which is why the fix usually lives on your website, not just in the ad account.

Is ROAS the Right Metric for Your Business?
ROAS is the right primary metric for e-commerce and any business with reliable, immediate revenue tracking. For others, it can mislead:
- Lead-generation businesses should lead with cost per acquired customer and closed-revenue ROAS, not raw ROAS on form fills.
- Subscription and SaaS businesses should judge on LTV-based ROAS, because first-purchase ROAS badly understates value.
- High-consideration purchases need a longer attribution window, or ROAS will look artificially low.
- Profit-focused advertisers increasingly use POAS (Profit On Ad Spend) to optimise on margin, not revenue.
Use ROAS as your fast daily gauge, but always tie it back to profit and customer value. If you want a clear picture of what your campaigns are really returning, a free audit will show your true ROAS, break-even point and where the quickest gains are.